30 Dec 2024
Investment: What’s a good return?
What’s a good return on my investment?
I hate to say a simple question has a complicated answer, but that’s the truth.
Returns on investments are all relative: they relate to the amount of risk being taken (but not necessarily in a predictable or straight-forward fashion). The more risk that is involved, the better returns (or returns in excess of “risk-free” cash rates) an investor might demand to compensate them.
So how much risk are you taking? And much more importantly, why are you taking that risk?
A good return is not simply the largest number, but should be evaluated against the risk-adjusted return. One of the ways to consider risk, is the spread between how much you stand to gain, but also how much you could lose (sometimes referred to as volatility – the swings in the value of your investment at any point in time). The most extreme example of this is leveraged investments, where you either borrow to invest, or only put in a fraction of the total capital required to make the investment – so if things go wrong you could end up owing more than you actually put in.
It is also relevant how investment returns are delivered – whether in a smooth, predictable fashion including income along the way, such as dividends, interest, or rent, or if returns are only on available on exit.
Information access and saleability of investments (often referred to as ‘liquidity risk’ – referring to how easily an investment can be turned into cash) are other key factors to consider. Many small and medium size business owners can see their own business growing much more rapidly than larger, publicly listed businesses, and they feel in control of their own destiny. But looked at objectively, investing in a small, private business is usually considered extremely risky: with lots of missing information (compared to the way public companies are obligated to divulge all sorts of data), and often a very limited range of buyers of the business. Perhaps the biggest difference for a small business owner is that a global company won’t fold very quickly if you die, whereas your own business might (that’s potentially an important insurance conversation for another day!)
With investment aims, your time frames become very relevant. If you’re planning on using or withdrawing a pot of funds within a short to medium time frame, in planning terms this could be anything less than 7 or even 10 years, then you may not want to experience significant volatility in the value of your investment. For example if you’ve earmarked some funds for a house deposit or property upgrade in 3 years time, then the last thing you want is for your investment to be down 30-40% in value 2 years from now – which can easily happen to a riskier equity-based investment given unpredictable financial markets.
Long-term expected returns are the subject of a fair degree of controversy, not least because it is very difficult to measure apples, oranges, and slices of toast in comparable ways. But it is generally accepted that long-term expected returns on lower volatility assets such as bonds, will be lower than those on more volatile assets such as equities. Within equities, for example, for much of the 20th century, emerging markets had higher long-term returns than developed markets, because they were much more volatile (but often faster growing when things went well). Long-term property returns can be harder to measure: investors tend to stay invested for a long time, but true accounting for costs (not just financially, but the personal sweat taken to manage these investments and the tenants therein) is often difficult to achieve. Underlying all of these is the risk-free return on very short-term bonds or cash. The term risk-free is misleading however, just look at the long spell in the 2010s of near-zero interest on cash holdings being outstripped by annual inflation in the low single digits in many cases. Now cash returns are decent again, but cash is also subject to volatility in exchange rates and purchasing power internationally, depending on the future success of a country’s economy.
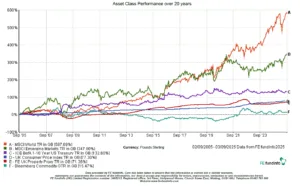
Above is a chart showing the last 20 years of accumulated investment growth in various different assets types – each line represents a composite index showing the performance over time of a different asset type or financial measure, including:
- Global equities (MSCI World)
- Emerging Markets equities
- 10-year US government bonds (known as Treasury Bills)
- UK property values (an index compiled by FE FundInfo based on national data)
- the UK consumer price index (the most commonly used measure of inflation)
- a composite of major commodity investment returns
20 years is a relatively short period of time however, and graphs like this can show very different results depending on when they are derived (for example America’s S&P 500 index famously experienced a ‘lost decade’ of near-zero growth in the early 2000’s after the original technology investment bubble burst).
History does not repeat itself, and the last 100+ years have shown all sorts of crises and dramatic changes in various assets and countries. But there are fairly consistent patterns to the history which suggest we must consider the risk-adjusted historically expected differences in asset class returns when choosing what assets to hold for longer-term investments.
Do you know what your investment strategy is? And more importantly, what the underlying purposes of the investments are?
If you want to discuss this more, or challenge me on my thinking here, click here to book a free initial conversation.
Note: Investments can go down as well as up in value, and you may get back less than your original investment. None of the above is financial or investment advice and you should speak to me or someone else professionally qualified to give you advice specifically tailored to your circumstances.
NOTE: Article updated September 2025


 Book a free introduction chat


